

AWS Cloud Project Bootcamp - Week 2
Week-2 Homework Challenge - Implementing Datadog to Monitor our Docker Containers

Telecommunication and Information Engineering student passionate about Cloud and DevOps. Join me as I document my journey "Above The Clouds".
After battling with containerization with docker in week-1, week-2 felt like a breath of fresh air. In hindsight, I feel like it was "The calm before the storm". Because frankly, what was yet to come in week-3 was not a walk in the park.
During week-2, the information given to us was that the fractional CTO had suggested that we implement observability and distributed tracing first. So that as we begin to add cloud services it wouldn't become difficult to pinpoint issues. This would help us keep pace with the development timeline. So with the strong leadership skills of our very own Community Hero (Andrew Brown) and guest instructor(Jessica Joy Kerr), we were able to implement modern observability. This includes and is not limited to:
As usual, you can find the links to the viewing material and learning resources at the end of this article. So from my understanding, there are two types of monitoring. That is:
Application Performance Monitoring
Server/Container Monitoring
What we implemented using honeycomb was Application Performance Monitoring(APM). Since we were free to make up our own homework challenges (as long as they are relevant to the week’s focus), I decided to go ahead and implement Datadog to perform container monitoring. Let's get straight into it.
So, what is Datadog?
Datadog is an enterprise solution for essential monitoring and security for your cloud applications. With end-to-end traces, metrics, and logs, datadog makes your applications, infrastructure, and third-party services entirely observable.
NB - I came to learn that Datadog has a name for the dog on their logo. His name is Bits. Now, don't be fooled by Bits. He might not look like it but he sure ain't one of those cute little dogs that make you go "Aaaawww! Choo chweet! So cute!". And I'll show you why in just a few.
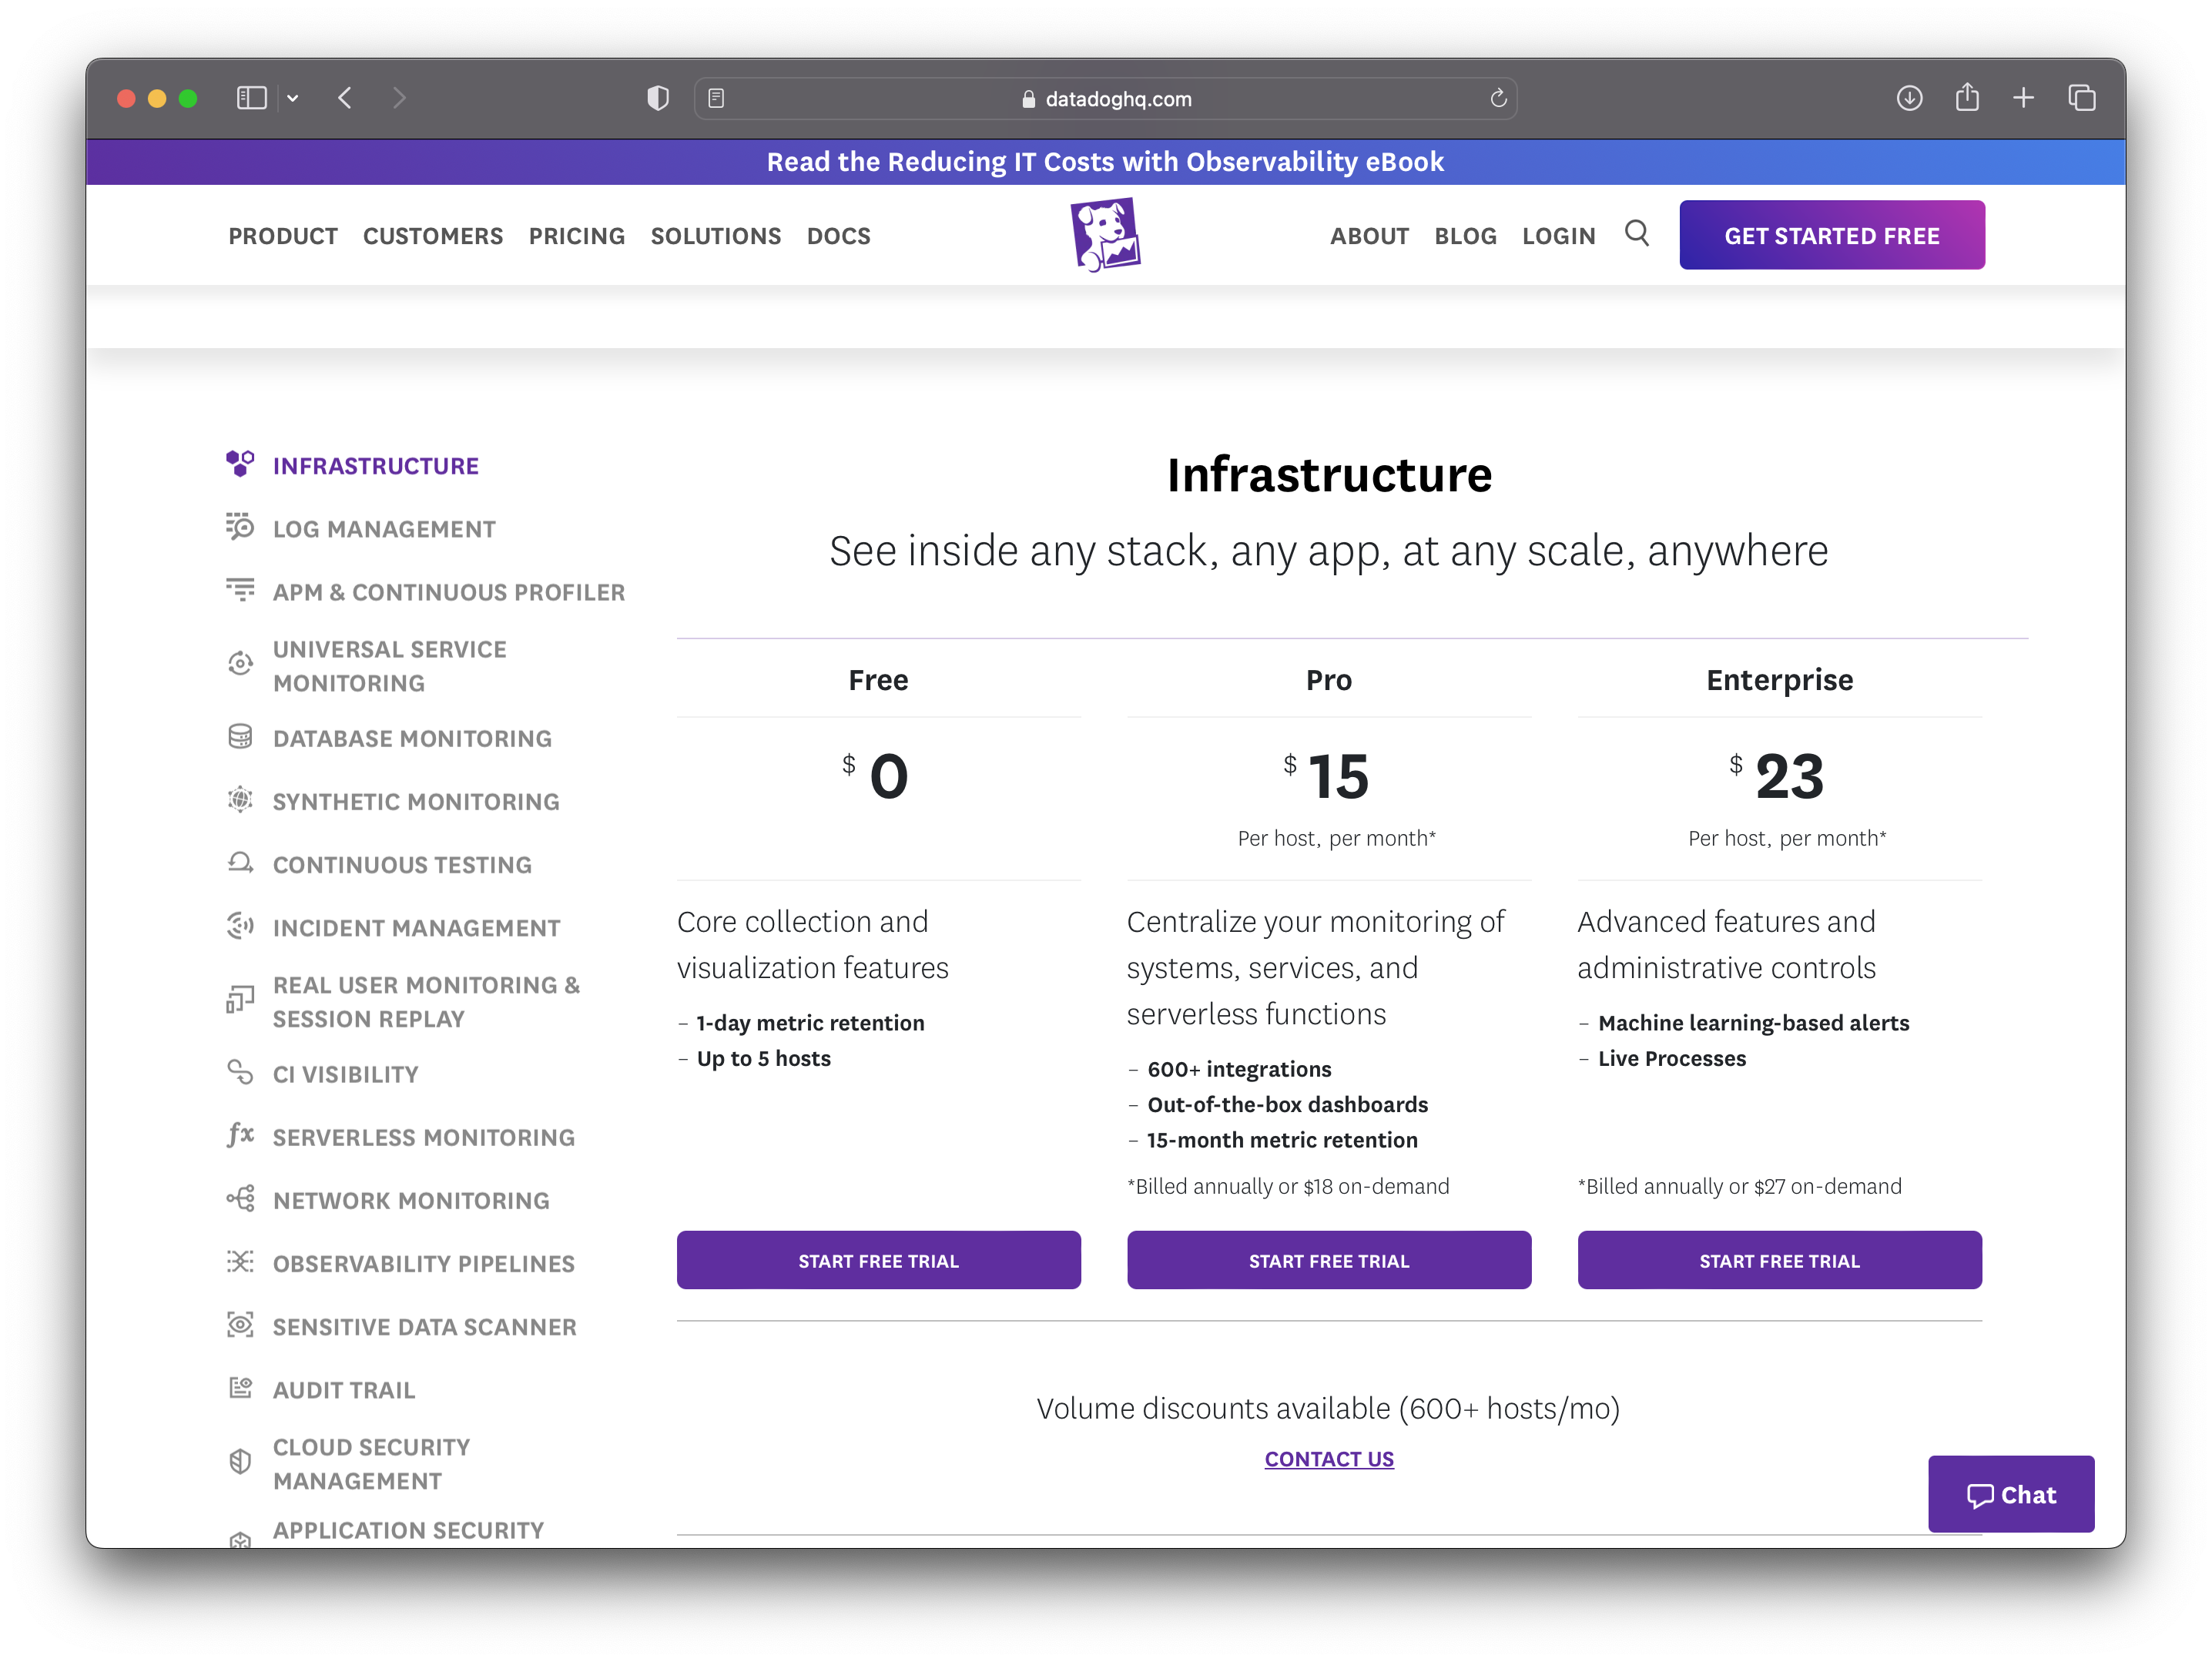
Pricing
As is with all enterprise solutions, there is a cost. Datadog pricing is broken down into two sections:
Pricing for datadog itself.
Price for where you’re running data.
Containers are supported in Pro and Enterprise plans. Depending on your plan, you can monitor 5 or 10 containers free for each host license. The container count is averaged across your entire infrastructure.
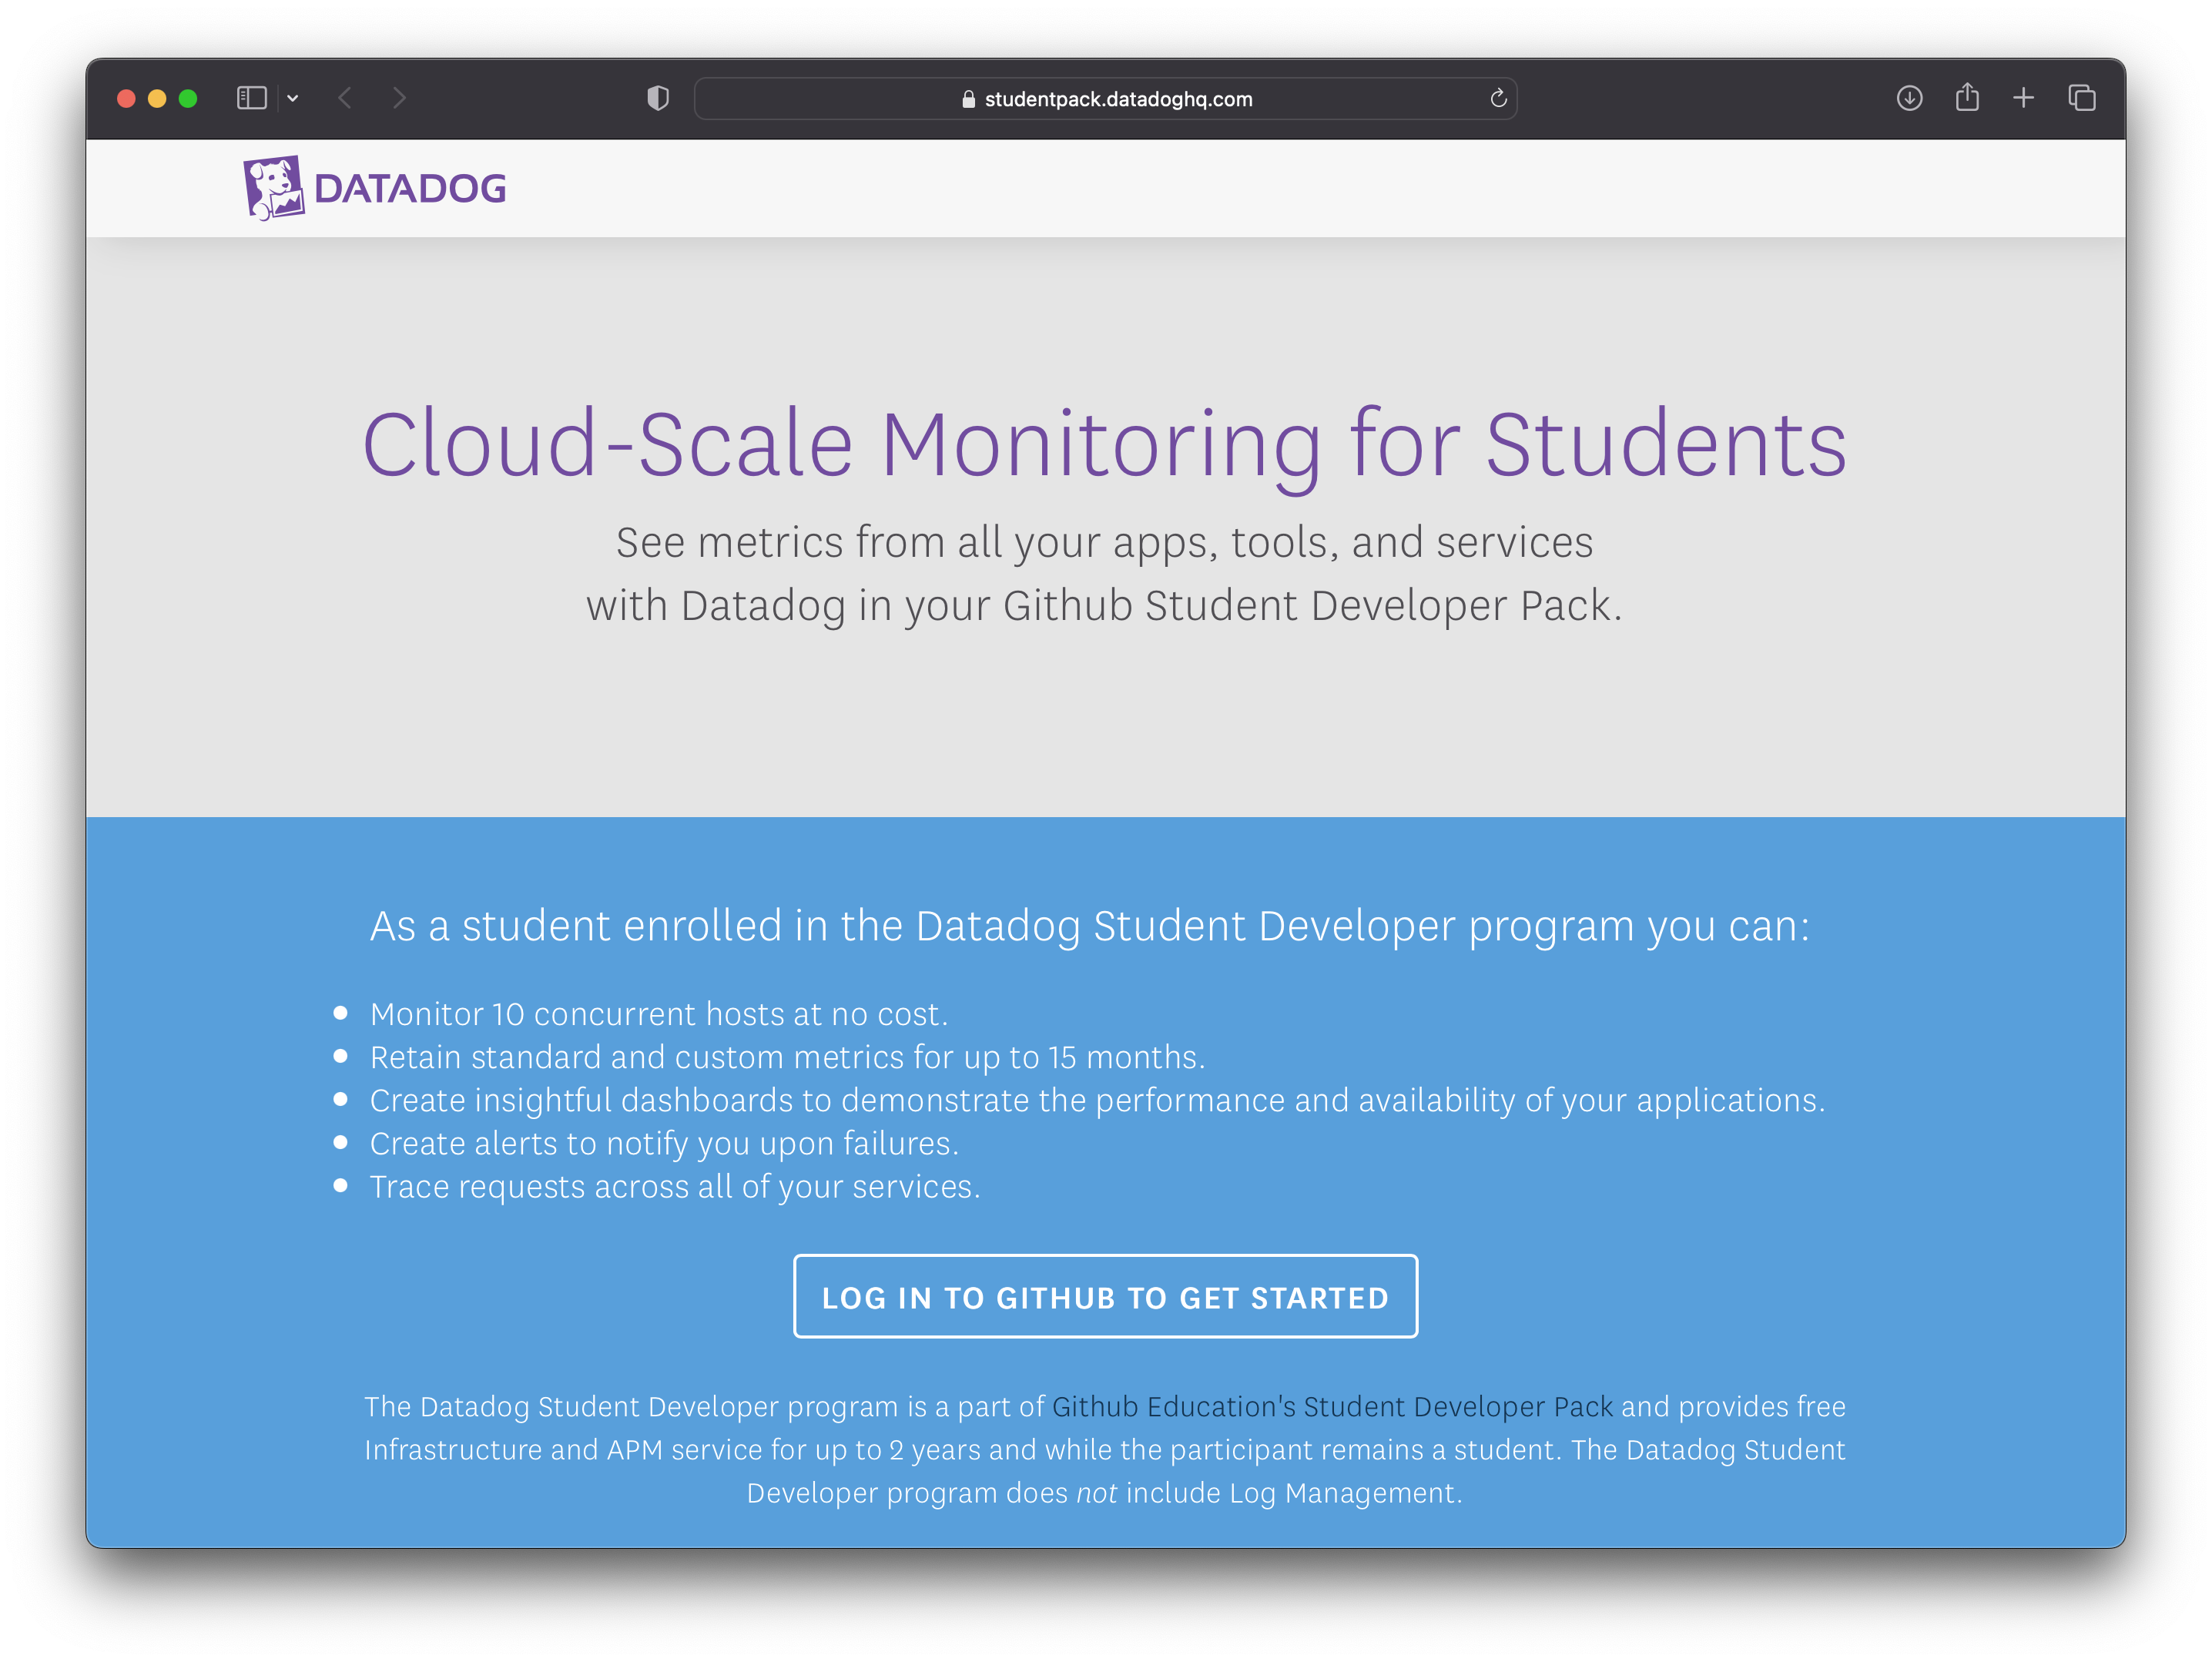
For my fellow students who are eligible for the GitHub Student Developer Pack, I have good news for you. Datadog is offering a Pro Account, including 10 servers, free for 2 years. Get access by connecting your GitHub account on Datadog.
Installing Datadog on Docker
After creating your user account. Log into the dashboard and navigate through the left side of the landing page and under Integrations hit Agent as shown below:
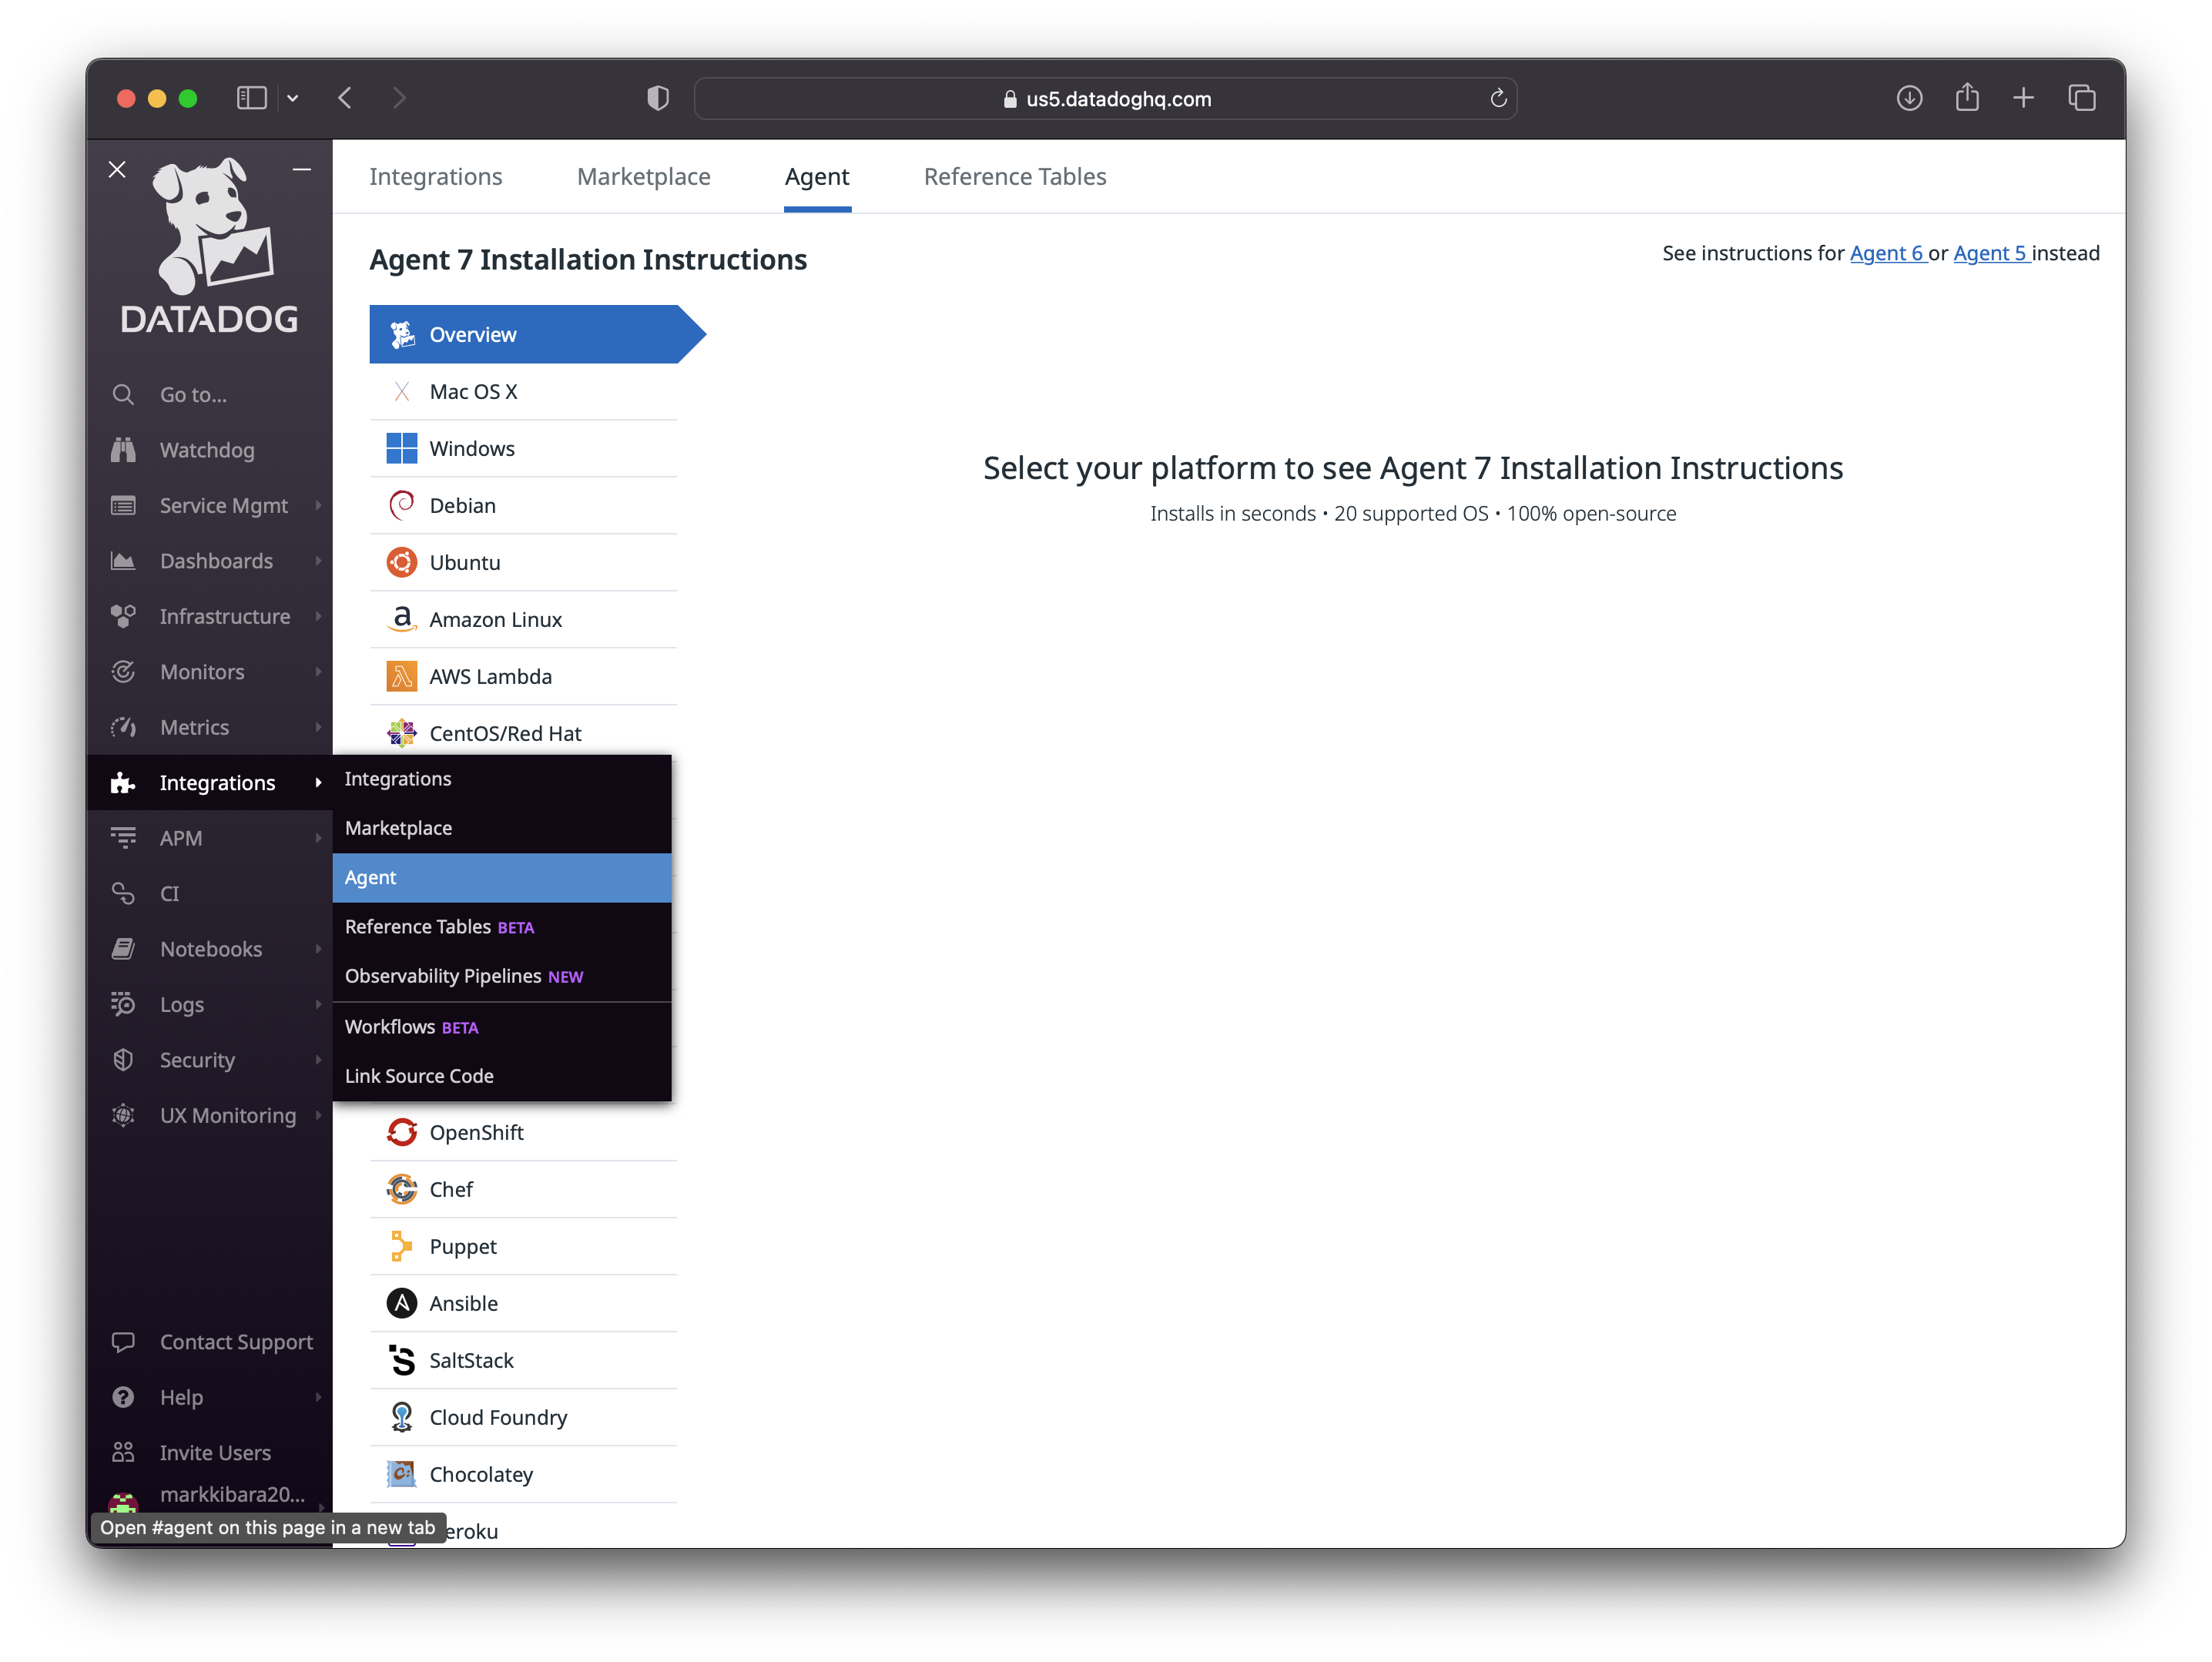
This page will assist us in the installation of Datadog Agent as a Docker container which will be monitoring our host. Lucky for us the Docker integration is enabled by default, as well as autodiscovery in auto config mode.
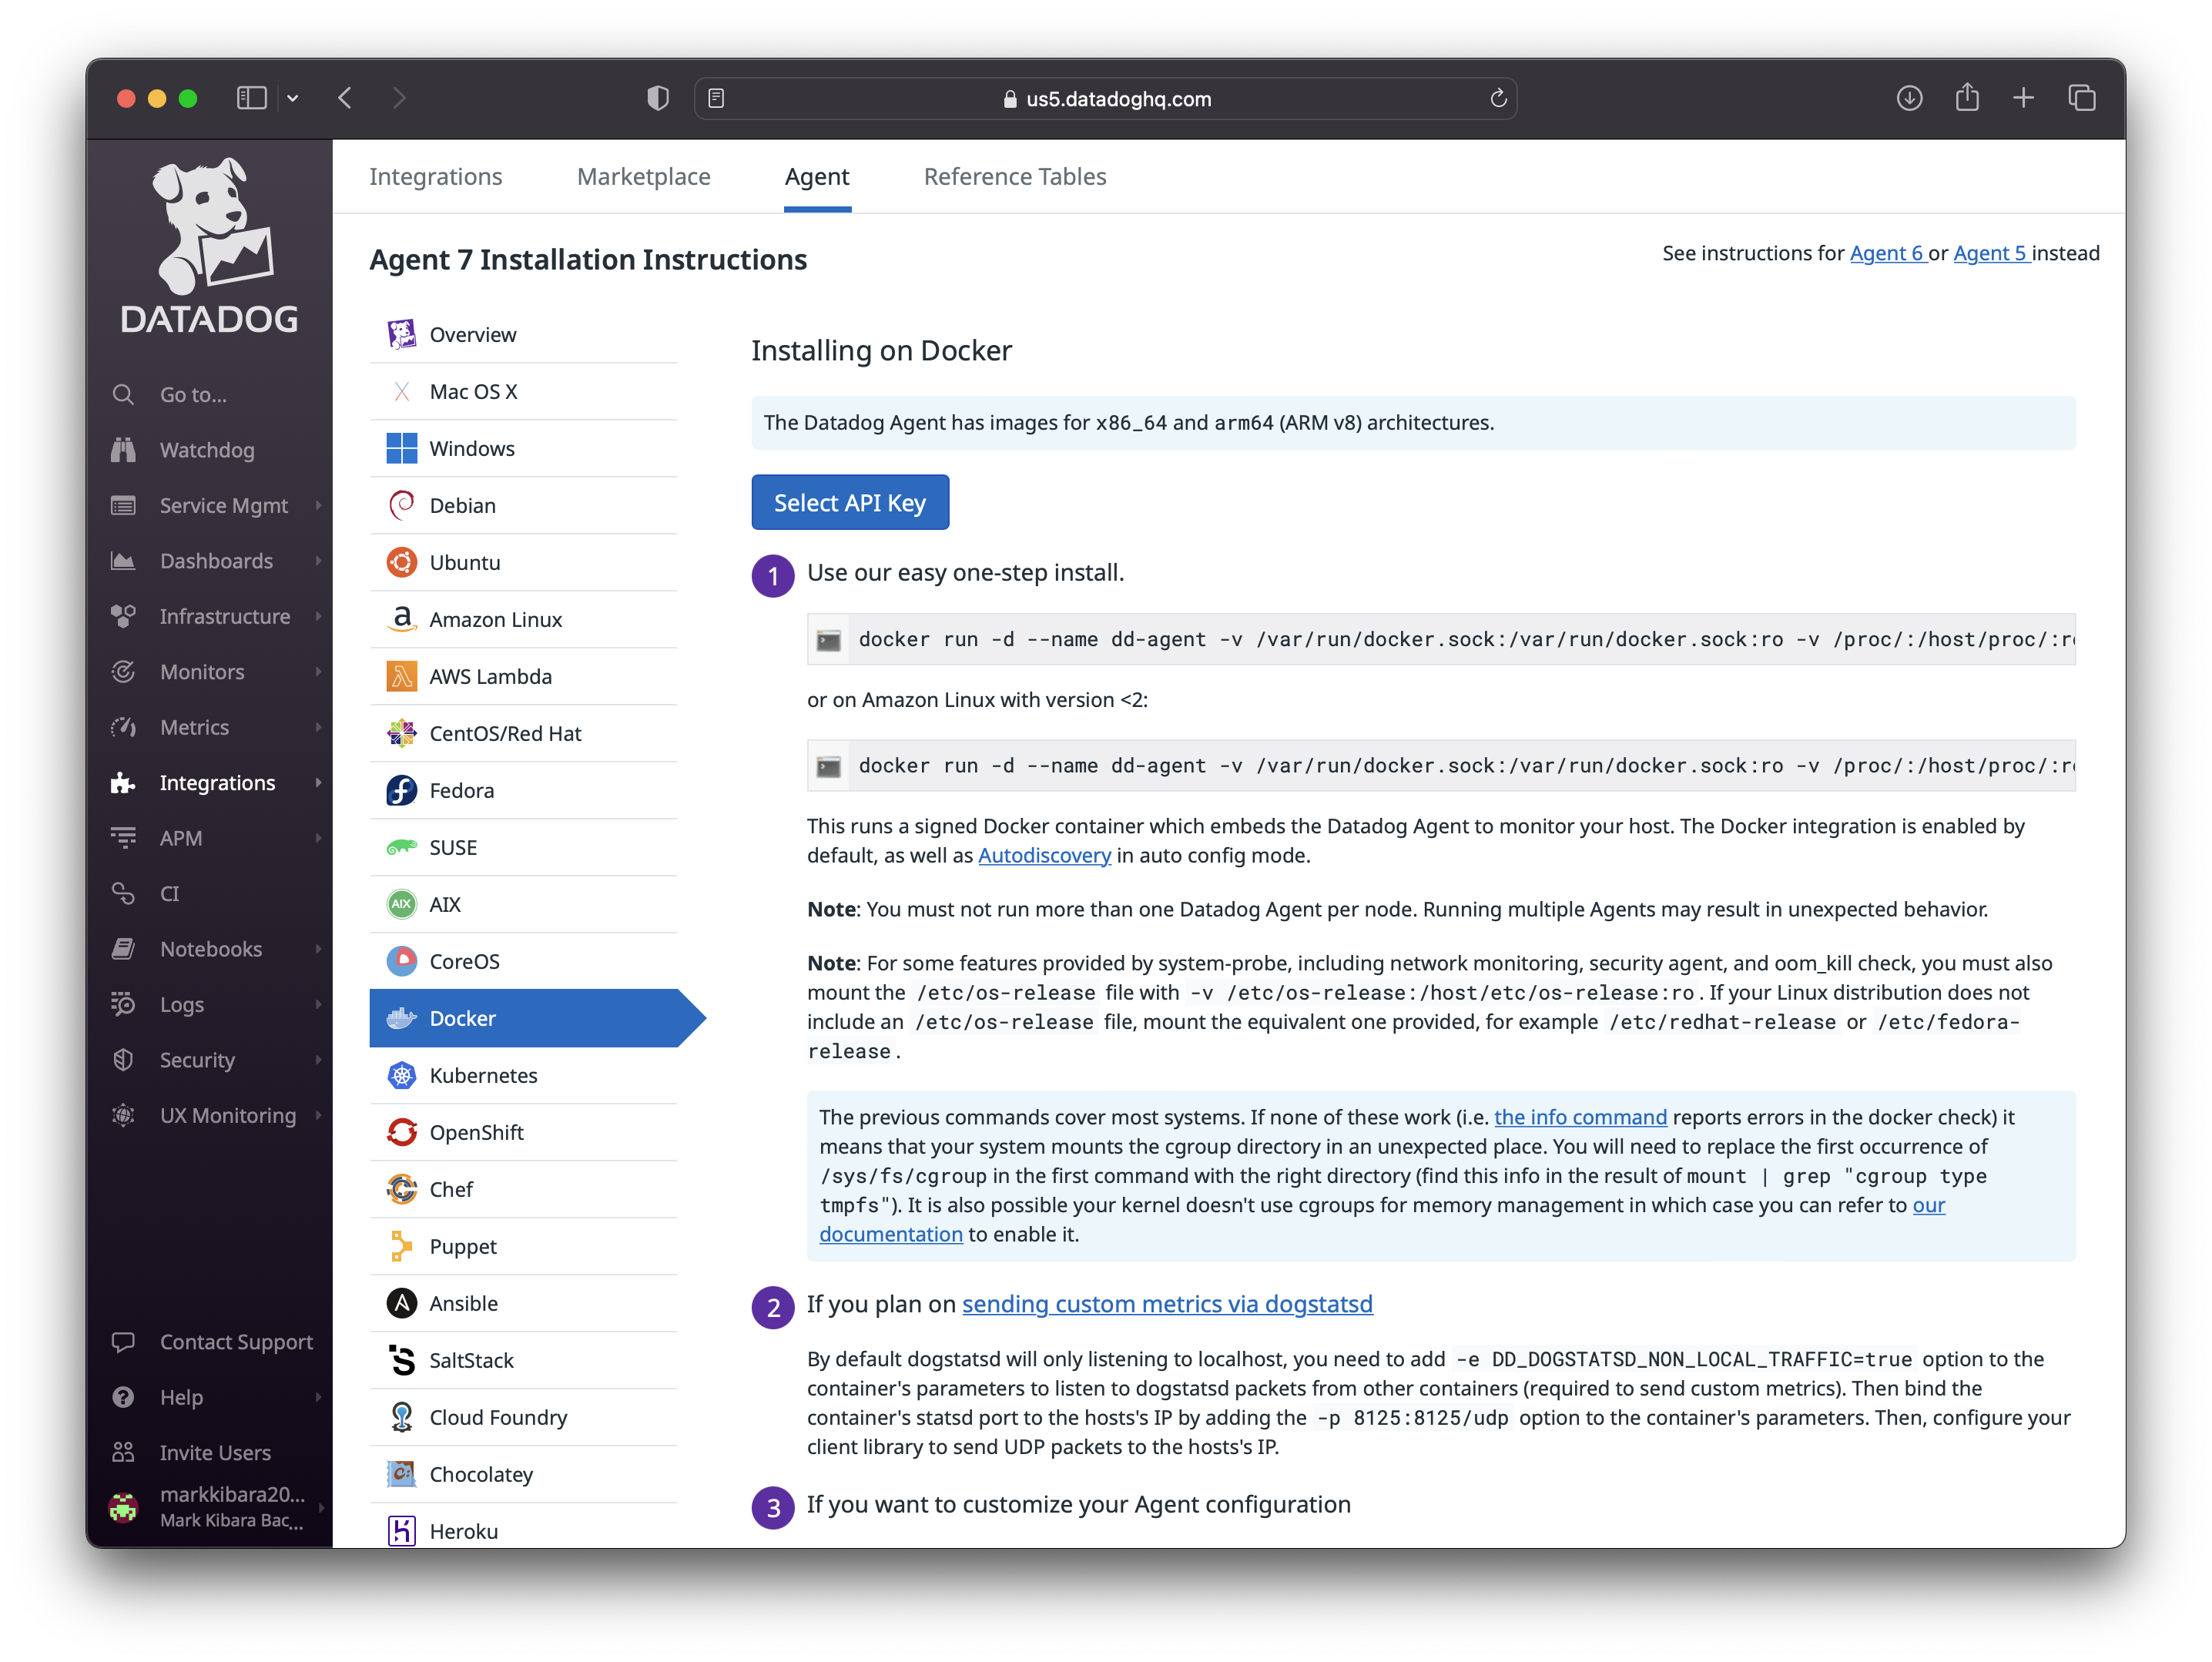
Proceed to 'Select an API Key'. This will create one if you do not already have it. It is also important to note that this API key is automatically generated. Since we are currently deploying our containers in a gitpod CDE. We will need to store this API key in our environment variables. Launch your gitpod environment and run the following command in your command line to save the API key.
# Save as env variable in current session
export DD_API_KEY="**********"

# Save as env variable in future gp sessions
gp env DD_API_KEY="**********"
Confirm the env variable is stored:

In our .gitpod.yml file, add the following block of code to always run the docker container on start-up
- name: datadog
    init: |
      gp sync-await aws
      docker run -d --name dd-agent -v /var/run/docker.sock:/var/run/docker.sock:ro -v /proc/:/host/proc/:ro -v /sys/fs/cgroup/:/host/sys/fs/cgroup:ro -e DD_API_KEY="${DD_API_KEY}" -e DD_SITE="us5.datadoghq.com" gcr.io/datadoghq/agent:7
      exit
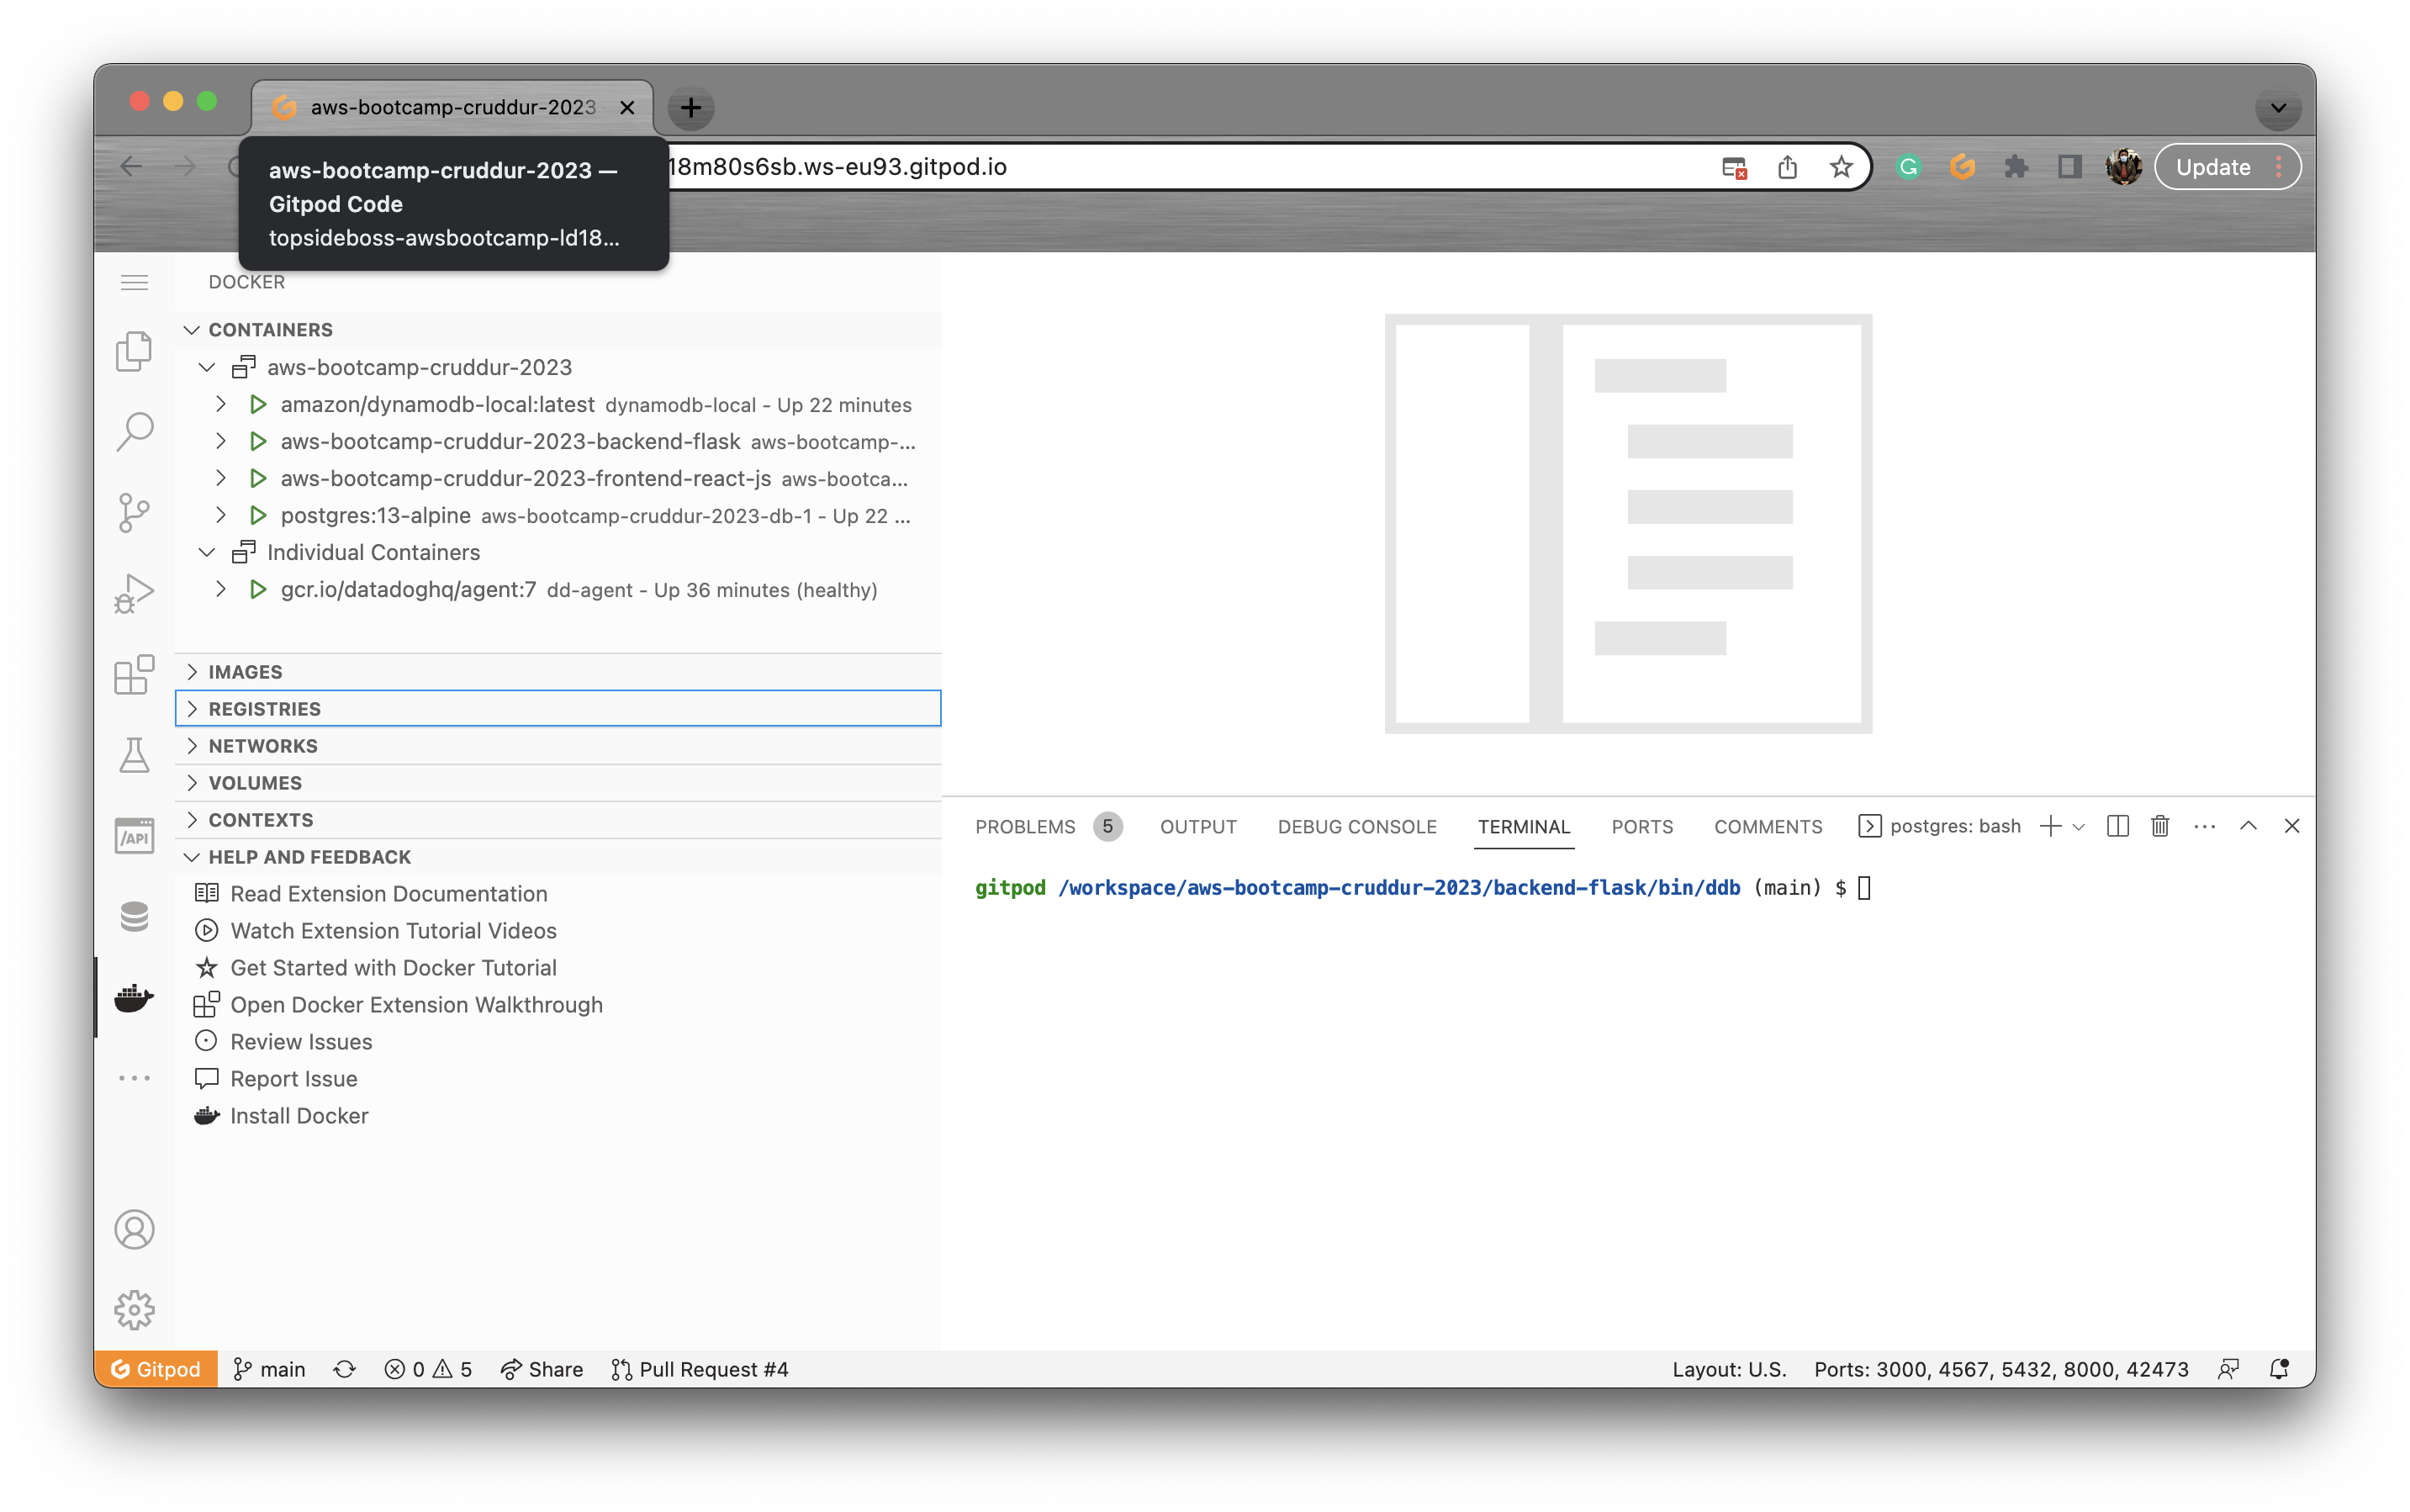
Now that the Datadog agent is deployed, run docker-compose up to run all your containers.
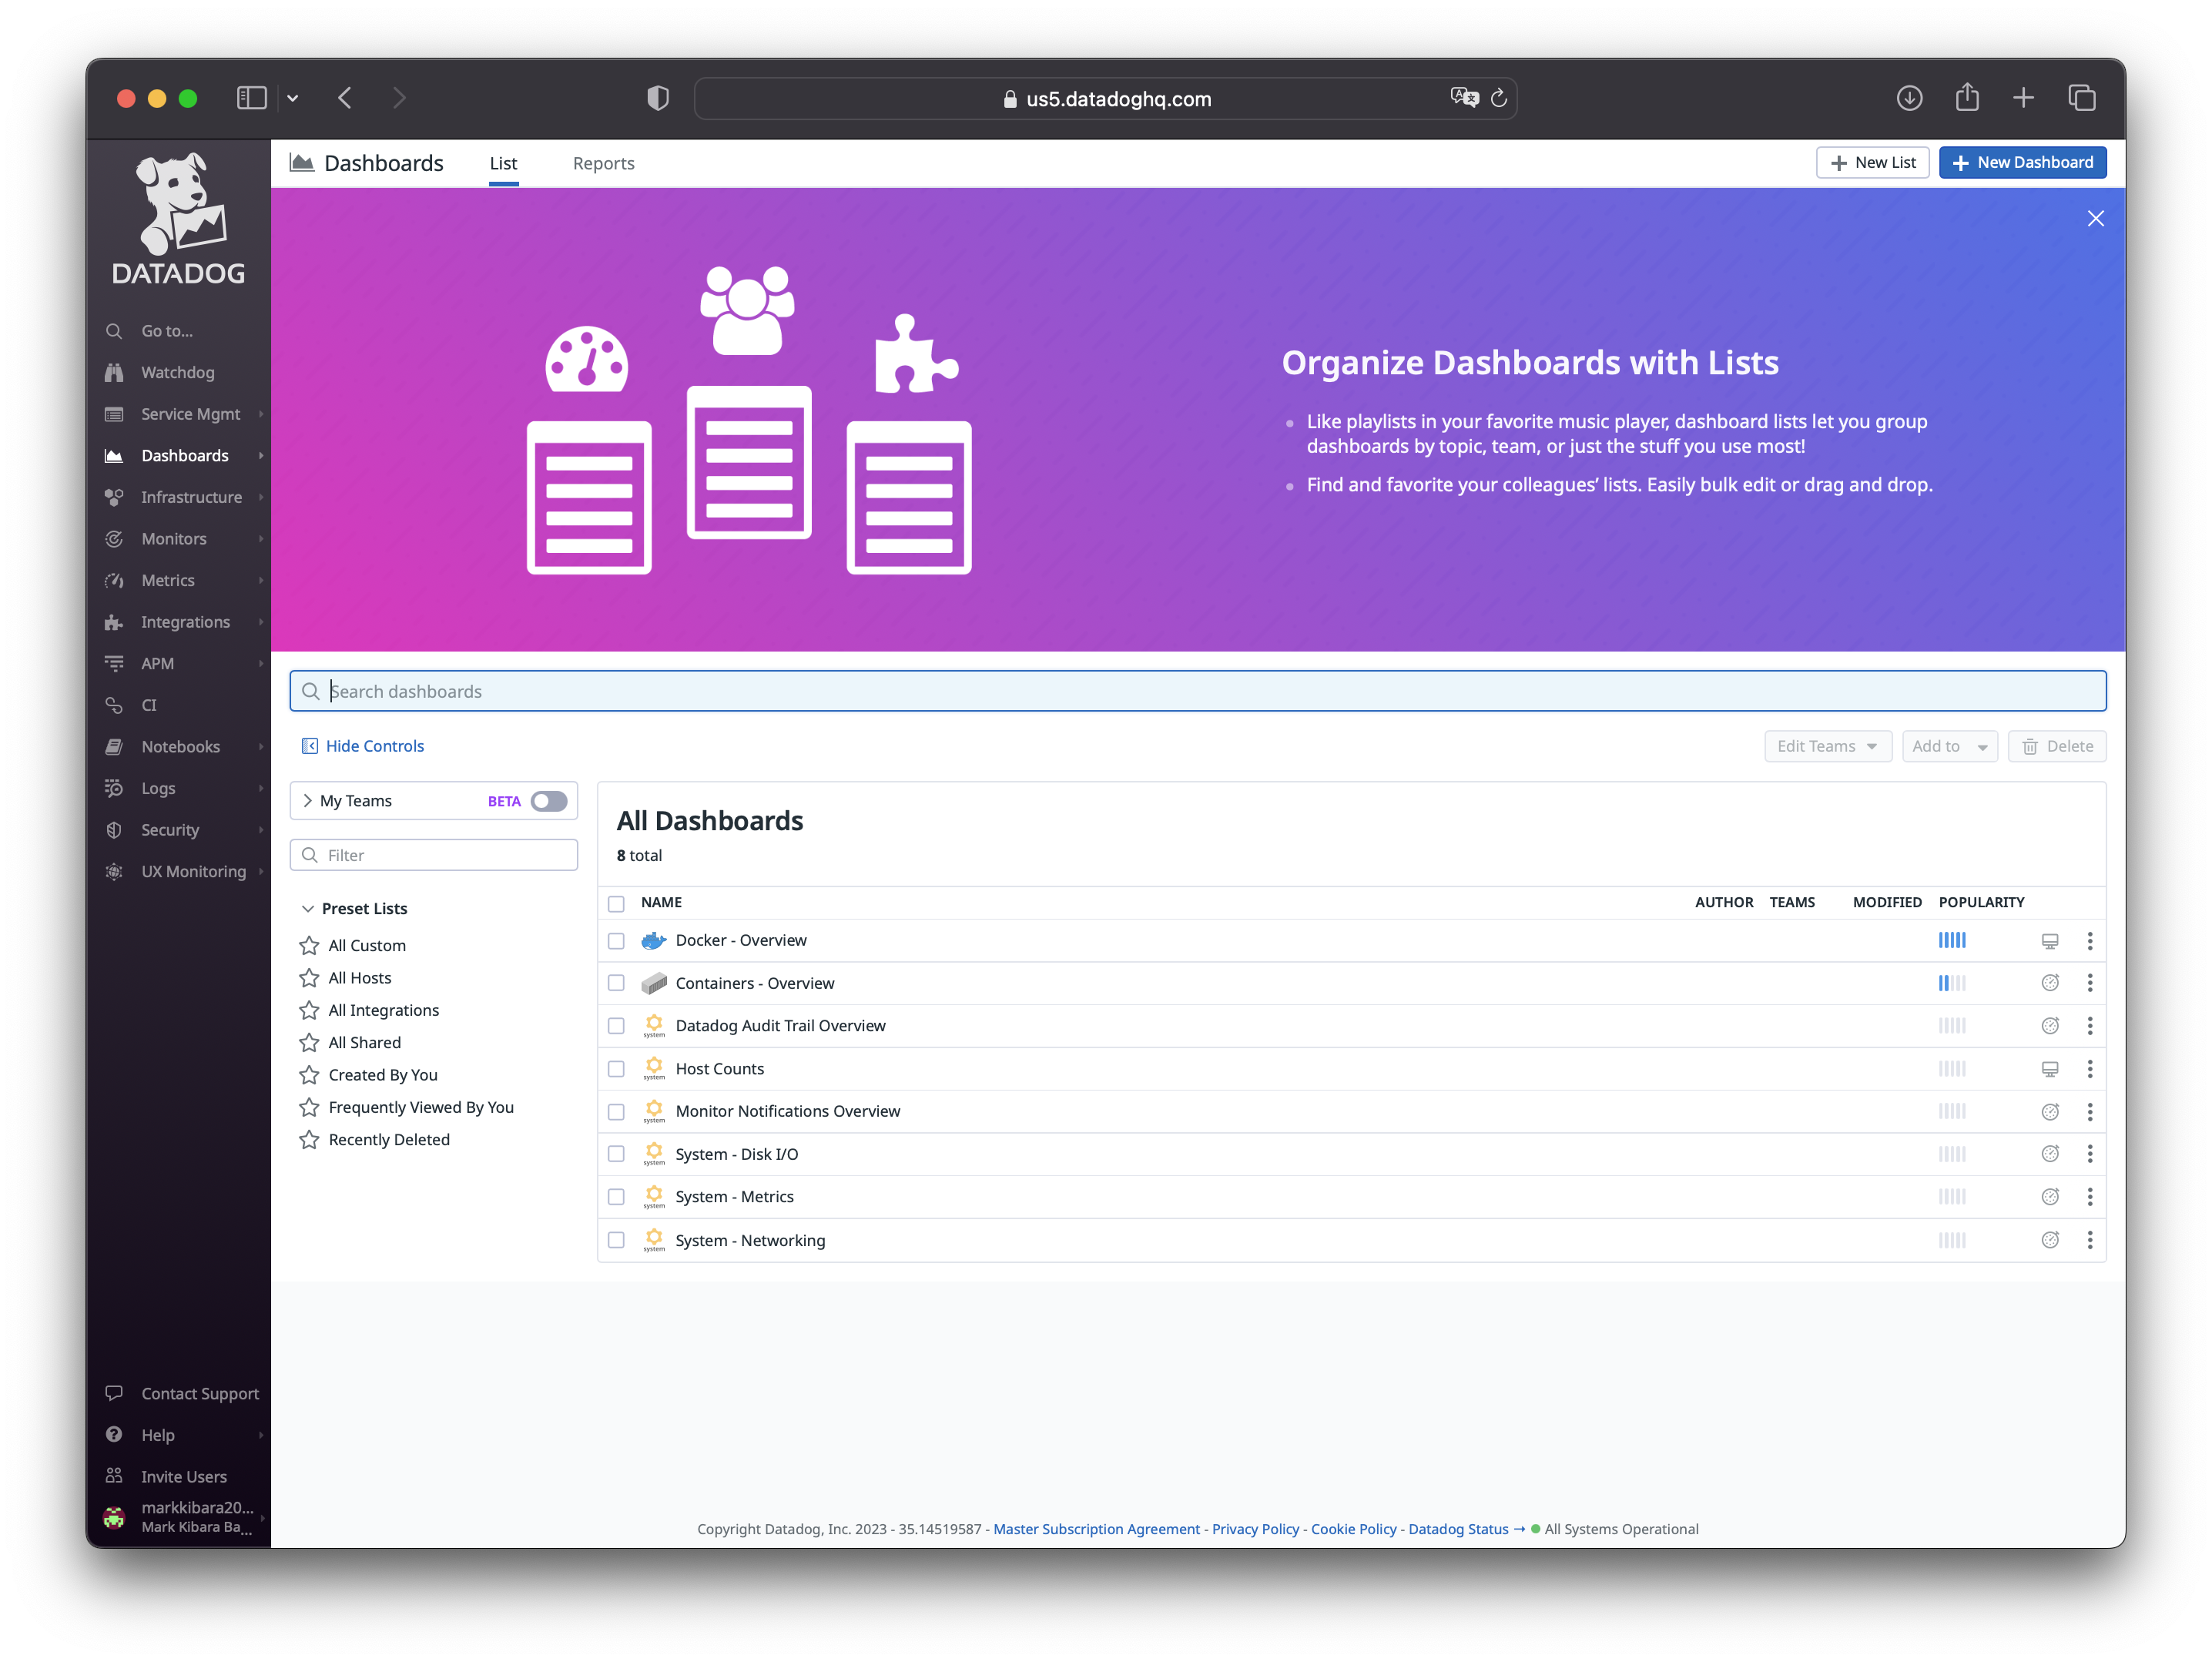
You can now view the data in the Datadog UI. Log in and navigate through the left side of the page and choose Dashboard as shown below:
Under Docker-Overview, you can see I have 5 containers running.
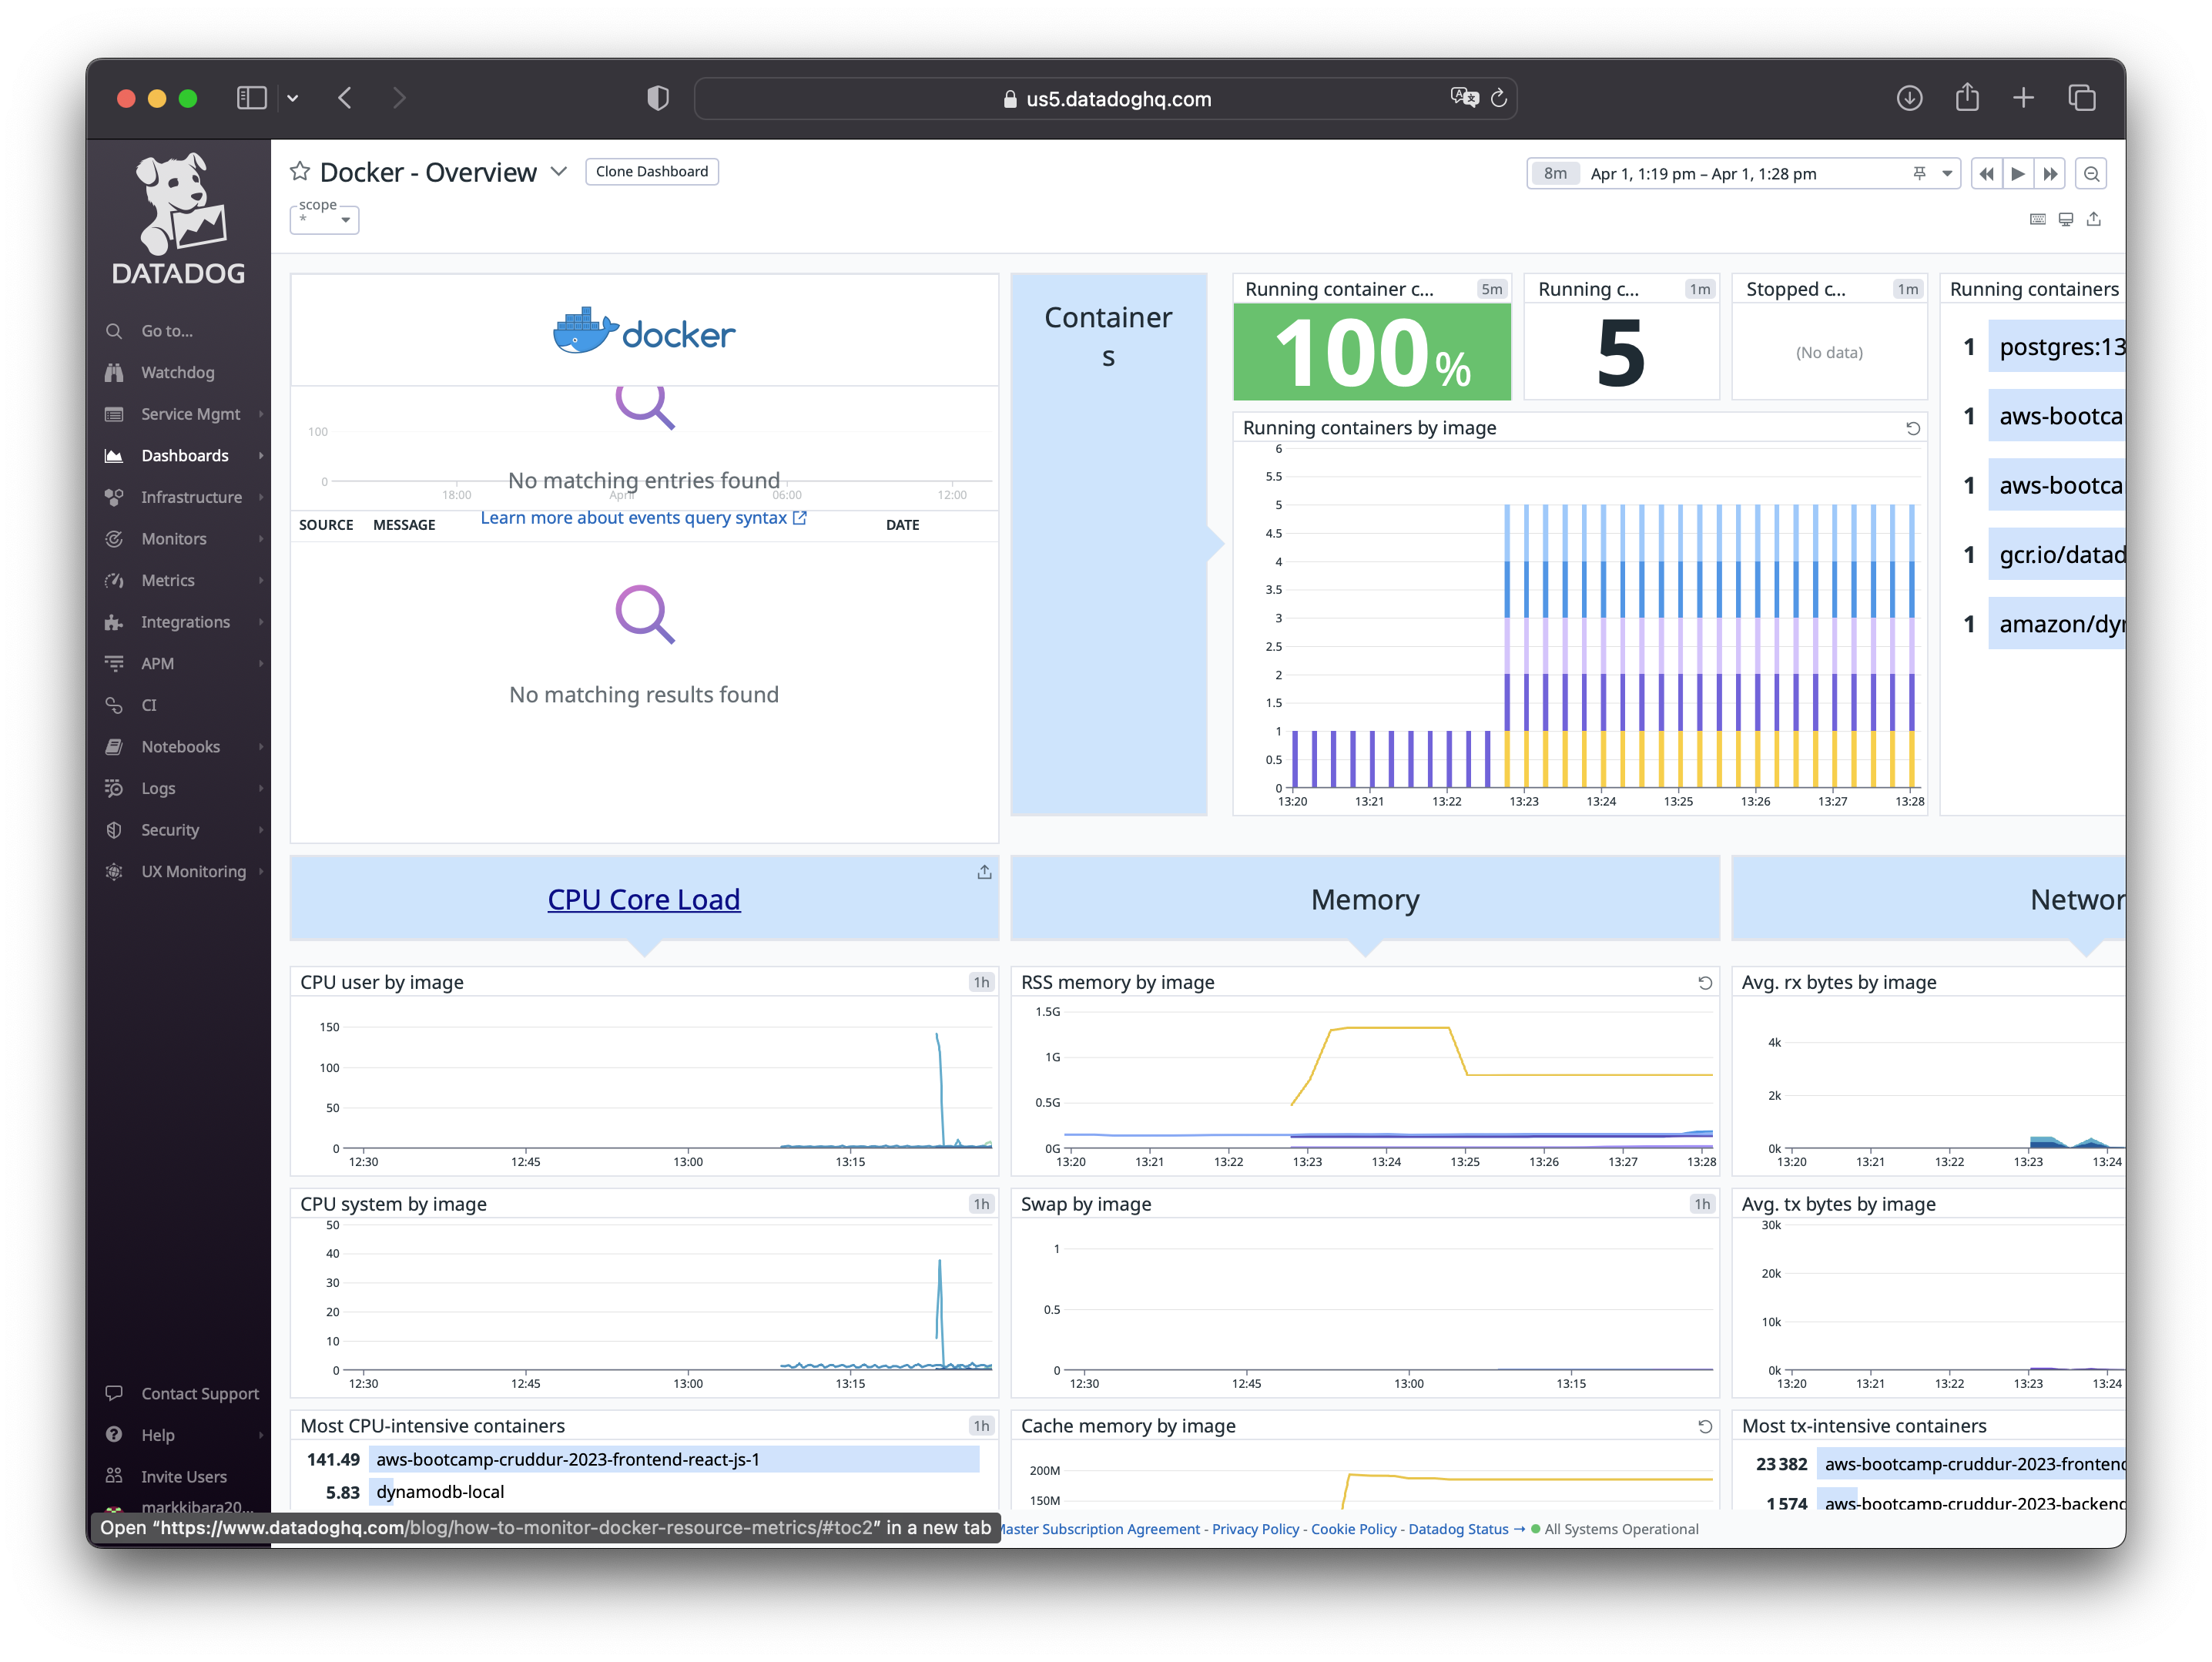
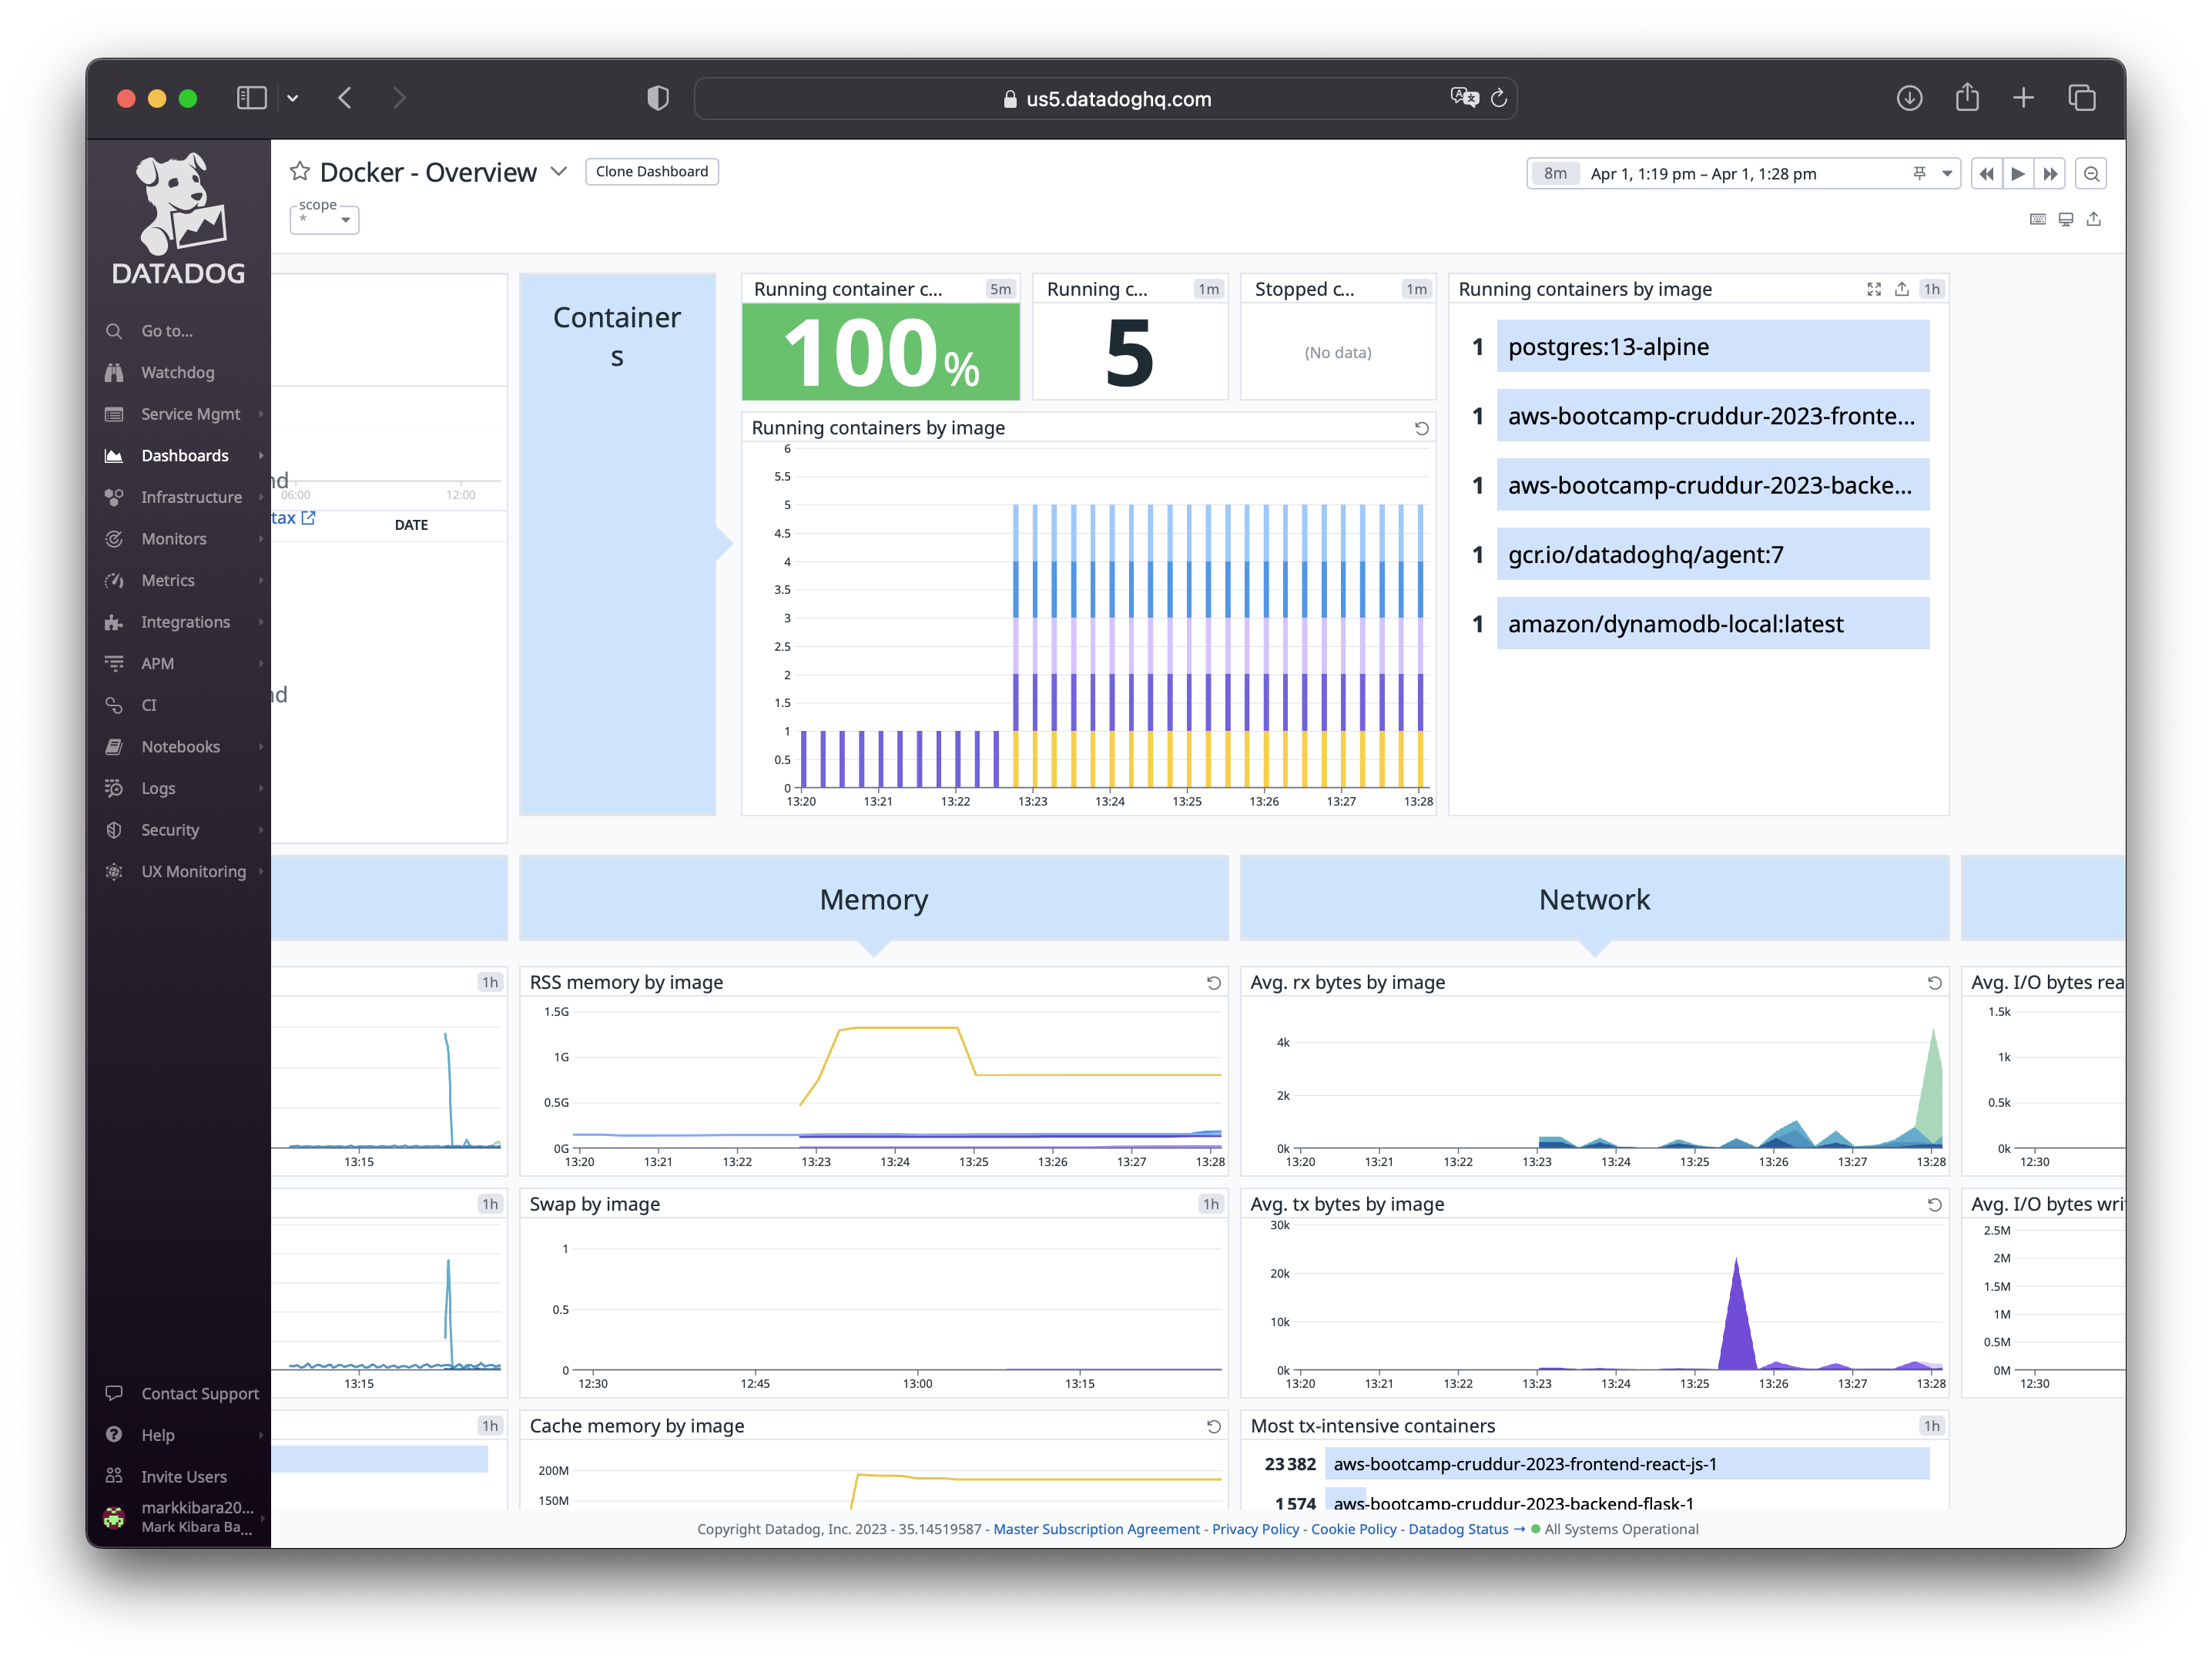
Under Container-Overview:
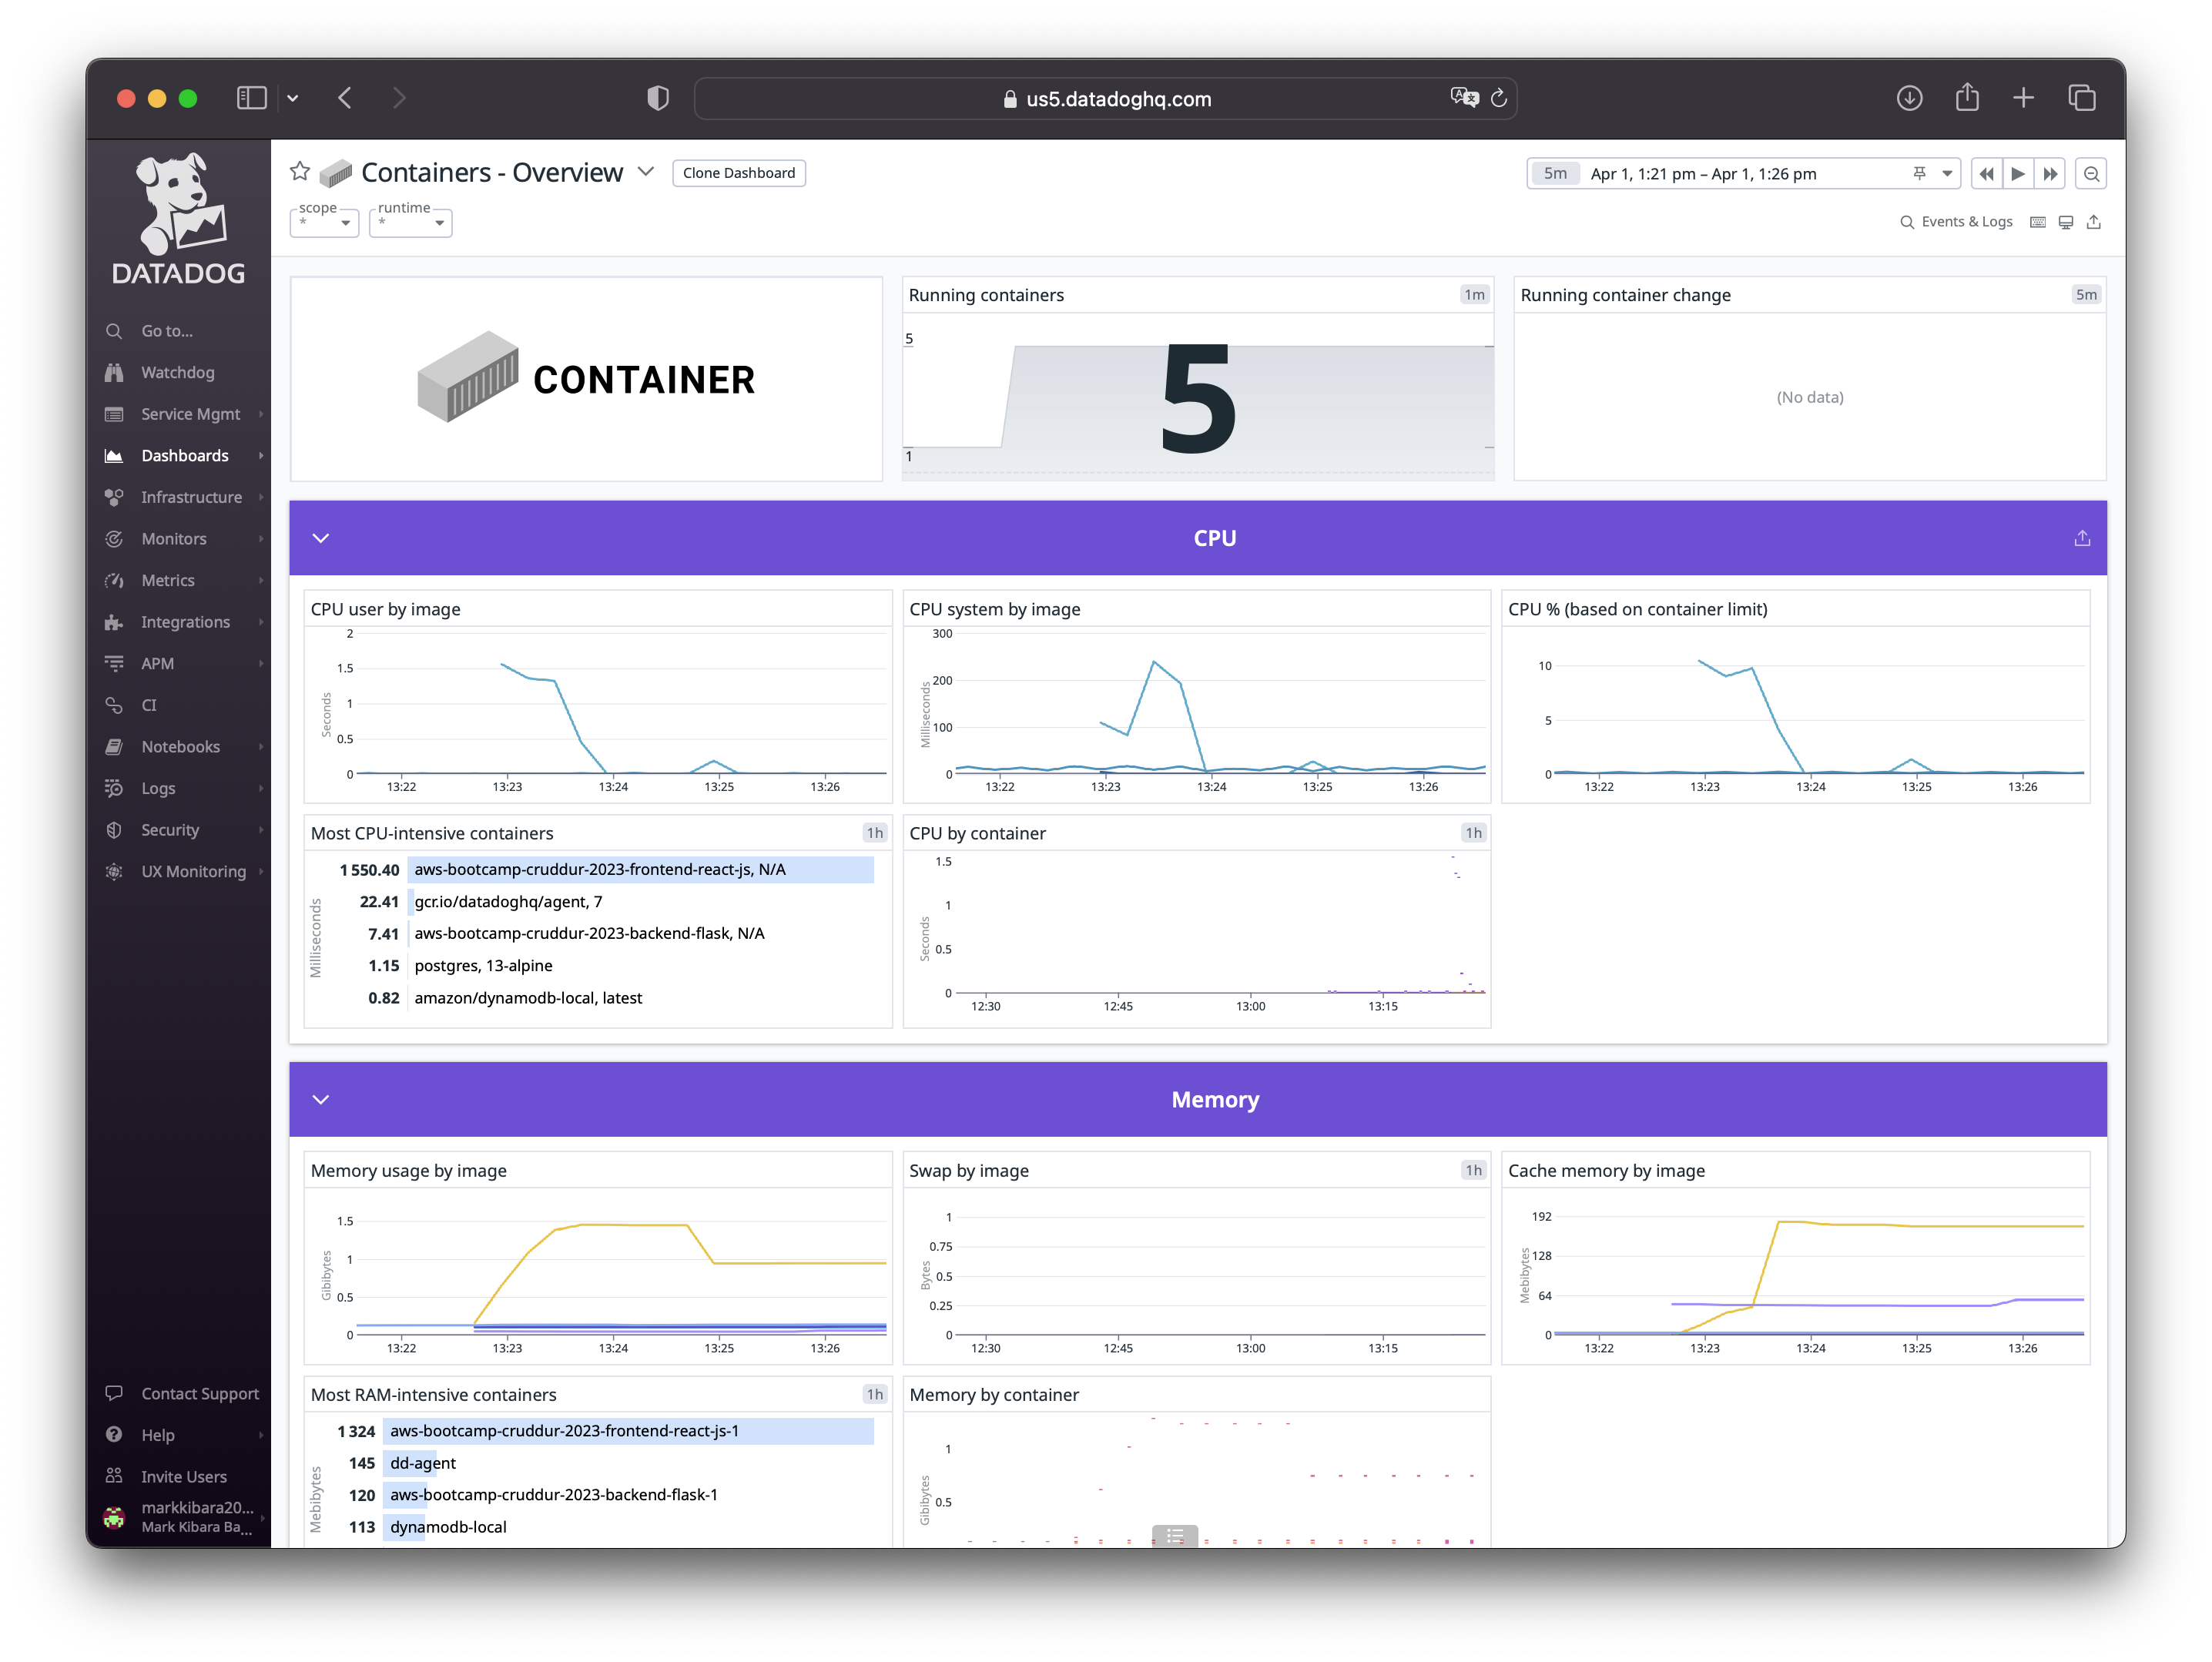

Now you can monitor several metrics on each of your containers such as:
Memory Usage
CPU Utilization
Network Intensity
I/O Read Operations
How simple was that? I hope you can now see how Bits is most definitely one badass doggo.
And with that, you can now be able to comfortably implement container monitoring with Datadog on your cloud web applications.
AWS-Cloud-Project-Bootcamp-Viewing-Material
As promised here are some quick links to the videos for Week 2.


